The results are in from the second semiannual unscientific attempt to survey Bay Area residents’ attitudes toward the Blue Angels.
Who responded
The survey was promoted on Twitter between October 8 and 10. My first Blue Angels survey, conducted in 2012, drew more than 180 responses; this year’s only got 135. Chalk it up to the crazy news week and my lack of social media clout. Anyway, with a total Bay Area population of seven million-plus, a survey this tiny has a margin of error of +/- nine percent. As I said, it’s unscientific.
About half of the respondents said they live in San Francisco; the other half live elsewhere in the Bay Area. Less than one-third were Bay Area natives; of those, two-thirds hailed from the city. Thirty percent have lived in the Bay Area for 10 years or less, twenty percent for 11 to 20 years, and half have lived here more than 20 years.
The ages of those respondents who volunteered it ranged from 22 to 61; the average was 39. Of those who answered a nonrequired, open-ended question about gender, 59 percent self-identified as male and 41 percent as female. Amazingly, only one person wrote in “gender is a social construct.”
Findings
In the first survey, people’s ratings of the Blue Angels were almost evenly split between love and hate. This time, the fans came out in force. I asked respondents to rate their approval of the Blue Angels on a scale of 1 to 5, with 1 meaning hatred and 5 meaning love. As in the 2012 survey, neutral scores (3s) were uncommon; people’s opinions about the Blue Angels tend to be pretty strong.
Respondents’ attitudes toward the Blue Angels
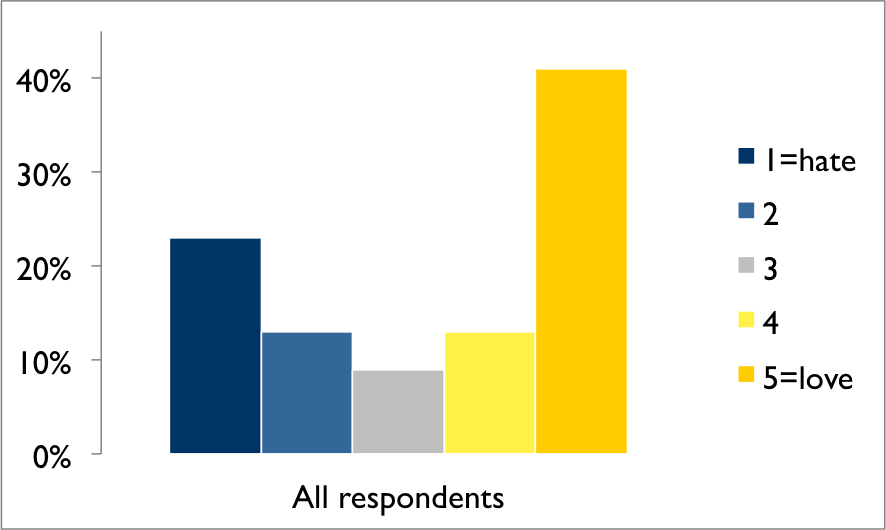
The average score was 3.3, with 5s outnumbering 1s nearly 2 to 1. Here are some other average scores broken down by various groupings, explained in more detail below.
Average scores by group (1=hate, 5=love)
| All respondents | 3.3 |
| Women | 3 |
| Men | 3.6 |
| SF natives | 4 |
| Bay Area natives | 3.3 |
| Non-natives | 3.2 |
| 0-5 year residents | 3.7 |
| 11-15 year residents | 2.6 |
| 20+ year residents | 3.5 |
| Tech employees | 3.7 |
| Non-tech employees | 3.2 |
| Flying phobic | 2.7 |
| Non-flying phobic | 3.4 |
| People who say “Frisco” | 3.7 |
| Tech guys who say “Frisco” | 4.6 |
In their own words: I asked respondents to describe the Blue Angels in one word. Some of the most common responses were: loud (19), awesome (13), annoying (7), exciting (7), and obnoxious (4). The most evocative response from a Blue Angels lover who didn’t follow the directions was “The sound of freedom.” The best response from a Blue Angels hater was “Worse than MUNI.”
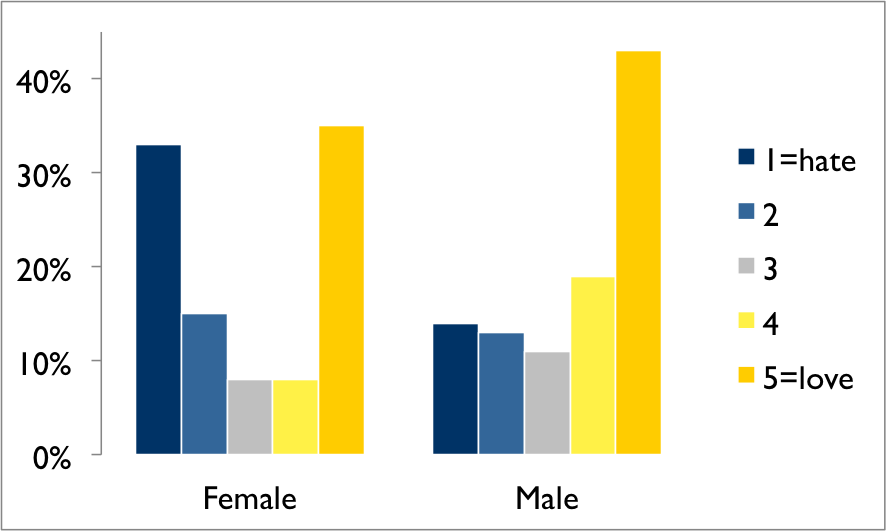
Gender: The average score for men was 3.6; for women, 3. But fans were well represented among women, 35 percent of whom handed out 5s—just slightly more than 1s. Among guys, the fans outnumbered the haters three to one. The overall average score weighted by gender was still 3.3.
Attitudes by gender (% of group)
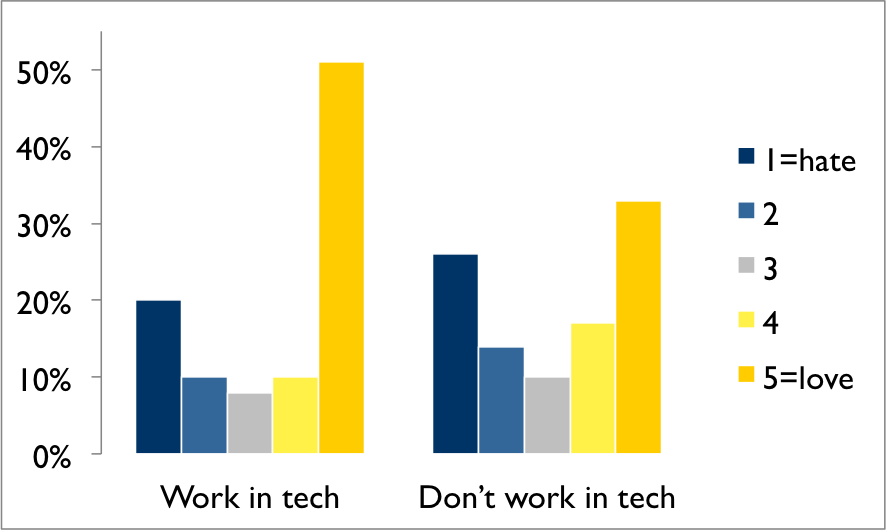
The tech factor: About 38 percent of respondents fessed up to working in tech. Among them, the love-hate divide was skewed heavily toward love, with 51 percent giving 5s and 20 percent giving 1s. The average rating from tech employees was 3.7; for non-techies, it was 3.2. (The average rating from guys in tech who have been here five years or less was 4.4.)
Attitudes by tech employment (% of group)
Natives and newcomers: I’ve always suspected that San Francisco natives are more favorably disposed to the Blue Angels, and the data bears that out. The average score from San Francisco natives was 4.3. For other Bay Area natives it was 3.3, and for non-natives it was 3.2.
Does living here longer make you like the Blue Angels more? Hard to say. More than 60 percent of newcomers (here for 5 years or less) gave 4s and 5s, though a quarter gave wishy-washy 3s. The detractors were the largest segment of those who have been here 11 to 15 years; nearly 60 percent gave 1s or 2s. But attitudes toward the Blue Angels softened among the old-timers (here for 20+ years), of whom 58 percent gave 4s or 5s.
Miscellaneous findings: The average score given by people who are afraid of flying was 2.7; from fearless fliers, it was 3.4. Homeowners’ average score was 3.6; renters’ was 3. Age didn’t seem to affect respondents’ attitudes.
Conclusion
While this survey remains highly, even dangerously, unscientific, it does suggest some interesting characteristics about who most loves and hates the Blue Angels’ nearly annual visit to San Francisco. Fans of the flyover are more likely to be found among men, SF natives, tech workers, and those who have no problem with “Frisco.” Blue Angels detractors are among women, transplants, renters, and those who dare not uttter the F-word.
If and when the survey returns, I hope to get a more substantial sample size. New info to collect could include race/ethnicity, the San Fran question, pet ownership (freaked-out pets are a common complaint about the Blue Angels), and whether respondents would consider naming a child after a flying aerobatic team (like The Edge, whose daughter is called Blue Angel).
Thanks to everyone to participated!
I’m gonna guess that John Travolta would give the Blue Angels a 5.