
About the survey
I launched the first Bay Area Blue Angels survey in 2012, when the Navy’s aerial stunt team made its annual appearance at San Francisco’s Fleet Week. I repeated the survey last year, and the sudden roar of jet engines over downtown San Francisco last week reminded me to update it. This year’s survey was promoted on Twitter and Facebook between October 6 and 9, eliciting a whopping 161 responses. (Better than last year’s 135 but still shy of 2012’s 180.)
As I’ve noted before, this is a highly unscientific, unserious survey. I’m just a guy with a Google form who prefers to leave the precision flying to the experts. Still, this year’s survey had some competition in the shape of a suspiciously similarly named quickie poll thrown up by a local mag.
Now armed with three years worth of “data,” a few patterns have emerged. Fans of the Fleet Week flyovers are more likely to be found among men, San Francisco natives, homeowners, and people who say “Frisco.” The Blue Angels’ detractors are more common among women, Bay Area transplants, renters, and pet owners.
Who responded
About half of the respondents said they live in San Francisco. About a quarter live in the East Bay, and the rest live elsewhere in the Bay Area. About 11 percent were San Francisco natives; 16 percent were Bay Area natives. Nearly half have lived in the Bay Area for eight or more years.
The ages of those respondents who volunteered it ranged from 19 to 69; the average was 41. Of those who answered a nonrequired, open-ended question about gender, 54 percent self-identified as male and 46 percent as female.
For the first time, I asked respondents to describe their race or ethnicity. Nearly 82 percent said they are white or a variation thereof, including “lily white,” “pale as shit,” and “white af.” Five percent said they are Asian-American, and five percent said they are Hispanic or Latino/a. Three percent said they are biracial or multiracial, and two percent said they are African-American. Unfortunately, this pool wasn’t diverse enough to make any meaningful observations of attitudes toward the Blue Angels by race. (Wish list for 2017: A bigger, more representative pool of participants.)
Love and hate
Across the three Blue Angels surveys, there has been no consistent split between lovers and haters. In the first survey, the ratings were almost evenly split between love and hate. In 2015, the fans came out in droves. And this year, the haters just edged out the fans, 34 percent to 27 percent. There was still a considerable trough of people in between, but just 12 percent gave neutral or ambivalent 3s. Once again, opinions about the Blue Angels tend to be pretty strong.
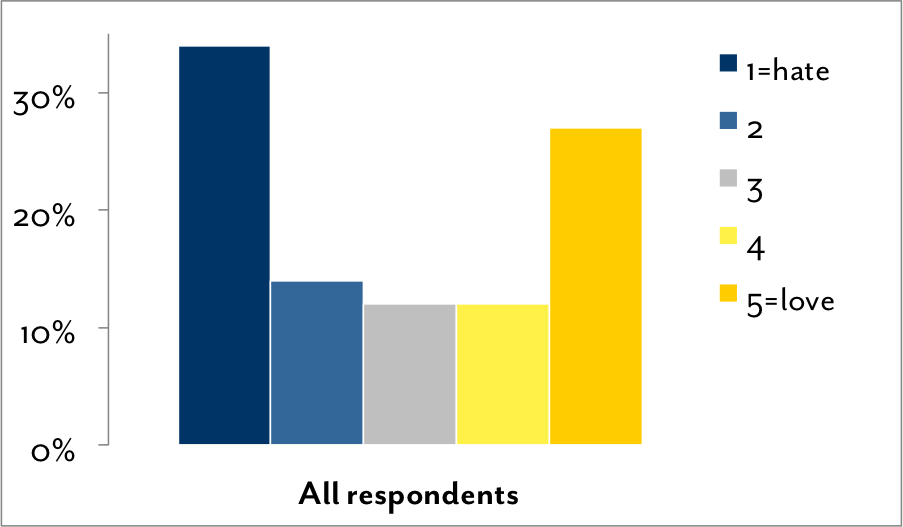
The relatively even split between both sides is reflected in the overall average score of 2.9 and median score of 3.0.
Here are some more average scores broken down by various groupings, explained in more detail below.
| All respondents | 2.9 |
| Women | 2.6 |
| Men | 3.1 |
| SF natives | 3.5 |
| Bay Area natives | 2.8 |
| Non-natives | 2.8 |
| Cat owners | 2.5 |
| Dog owners | 2.5 |
| Tech employees | 3.1 |
| Non-tech employees | 3.0 |
| Pro-“Frisco” | 3.5 |
| Anti-“Frisco” | 2.7 |
| Pro-“San Fran” | 3.0 |
| Anti-“San Fran” | 2.8 |
| Tech guys who say “Frisco” | 3.9 |
Loud and proud
I asked respondents to describe the Blue Angels in one adjective. The most frequent responses were “loud,” “awesome,” and “annoying.” Some one-off answers included “balletic,” “cat nightmare,” “deafening,” “glorious,” “nationalistic,” “tedious,” “triggering,” and “weird.” And one wise-ass wrote in “blue.”
| Amazing | 2 |
| Annoying | 12 |
| Awesome | 18 |
| Awful | 3 |
| Cool | 2 |
| Dangerous | 4 |
| Exciting | 7 |
| Loud | 20 |
| Scary | 4 |
| Wasteful | 3 |
| Unnecessary | 3 |
Dogs vs. cats
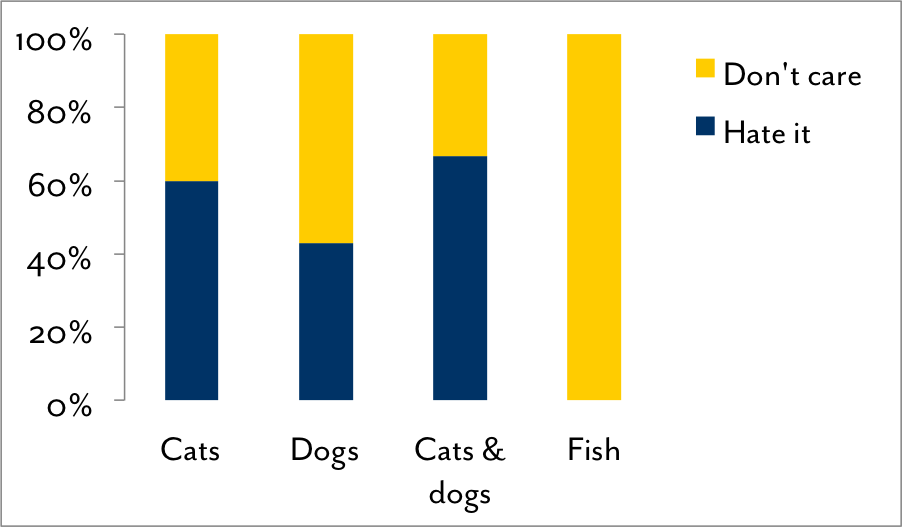
 Fifty-seven percent of dogs don’t care about the Blue Angels.A common complaint about the Blue Angels is that they freak out animals. (See “cat nightmare,” above.) So this year, for the first time, I asked about pets’ reactions to them. About 60 percent of cat owners reported that their felines hate the Blue Angels, compared with 43 percent of dog owners. More than two-thirds of households with both cats and dogs reported that their animals hate the jets. And one fish owner said that their aquatic companion—surprise!—does not care about the Blue Angels.
Cats’ and dogs’ differing opinions of the Blue Angels were not reflected in a similar split among their owners. Both cat and dog owners had average scores of 2.5.
The gender split
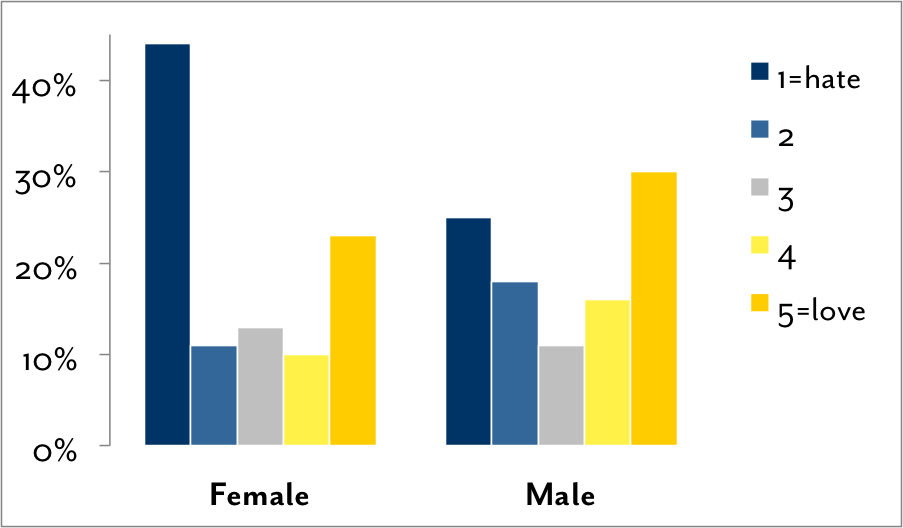
Once again, one of the most predictive characteristics of someone’s opinion about the Blue Angels is gender: Men like them more than women—or more accurately, they dislike them a lot less. The average score for men was 3.1; for women, 2.6. (Last year, it was 3.6 for men and 3 for women.) Among women, there were nearly twice as many haters as fans. While the male fans outnumbered the haters three to one last year, this year both sides were pretty evenly matched among the dudes. The overall average score weighted by gender was 3.0.
Frisco and San Fran
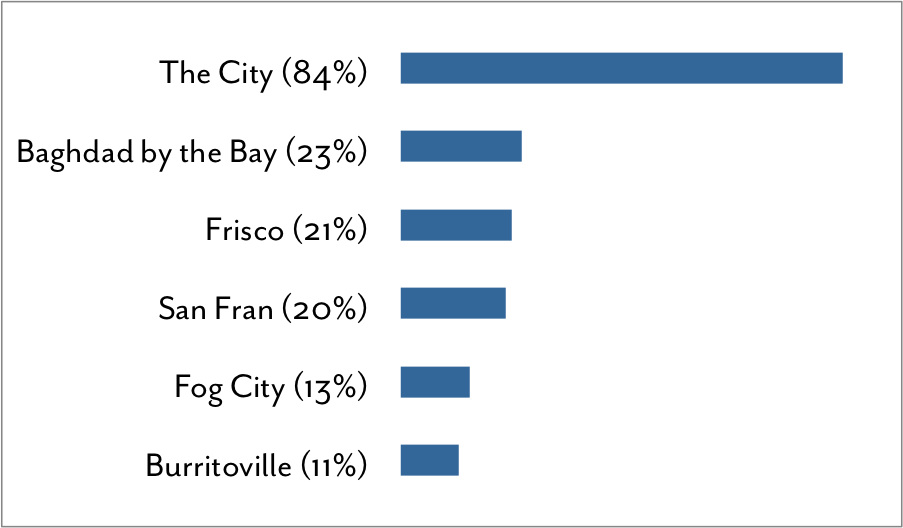
Last year, for fun, I asked respondents if it’s ever okay to call San Francsico “Frisco.” Nearly 80 percent said no. This year, I expanded the question to gauge attituides toward several nicknames for the city. Respondents overwhelmingly endorsed calling The City “The City.” About 23 percent signed off on the Herb Caenism “Baghdad by the Bay,” while just 11 percent bit on “Burritoville,” a moniker that I hope is never repeated beyond this survey.
A more liberal attitude toward “Frisco” corresponded with higher Blue Angels ratings. Pro-“Frisco” folks had an average rating of 3.5. The benighted 20 percent who approved of “San Fran” had an average score of 3.
Natives and newbies
Once again, the survey found that San Francisco natives are more favorably disposed to the Blue Angels than newcomers and transplants. The average score from San Francisco natives was 3.5. For other Bay Area natives and non-natives it was 2.8. The length of residence didn’t affect respondents’ attitudes greatly.
The tech factor
As I did last year, I asked respondents if they work in tech, whatever that means. About 28 percent said they do, considerably less than in 2015. Last year saw a big gap between the tech and non-tech respondents, with the techies being much more into the Blue Angels. This year, the gap evened out. The average rating from tech employees was 3.1; for non-techies, it was 3.0. Among tech workers, the love-hate divide was evenly split, with 36 percent giving 5s and another 36 percent giving 1s.
Once again, one of the most pro-Blue Angels subgroup I found was tech guys who approve of “Frisco,” who had an average rating of 3.9
Feelin’ the afterburn?
 Loud, polarizing, and known for dangerous stunts near large crowdsBecause it’s an election year, I couldn’t resist seeing if people’s political preferences predict attitudes toward the Blue Angels. I asked respondents who, in a perfect world, would win the presidential election, which I figured would be a good gauge of actual preferences. The big shocker here was that Hillary and Bernie supporters both had average scores of 2.7. Two self-professed Trump supporters gave the Blue Angels 5s. Other dream presidents included third-term Obama (average score 2.8), Joe Biden (4.0), Elizabeth Warren (3.0), Chuck Norris (3.0), and zombie Jerry Garcia (1.0).
Miscellaneous findings
Homeowners’ average score was 3.2; renters’ was 2.6, repeating a pattern observed last year. Once again, age didn’t seem to affect respondents’ attitudes.
Thanks again to everyone to participated!
The next survey will definitely include a question about the Blue Angels’ yellow flight suits.